We’re all in for
investors.
People are our most important assets. Many of us are avid investors—that helps us see things from our clients‘ angle and develop products they really need.


OUR STORY
Chicago – Where Morningstar Started
It started with an idea—one great idea from a 27-year-old stock analyst. Joe Mansueto thought it was unfair that people didn’t have access to the same information as financial professionals. So he hired a few people and set up shop in his apartment—to deliver investment research to everyone.
OUR STORY
Our Mission: To Empower Investor Success
We didn’t know then what the company would look like today, but we knew the commitment to our mission—to empower investor success—wouldn’t change. We’ve empowered investors all over the world, and we’re continuing to look for new ways to help people achieve financial security.
employees
0
countries
0
investments covered
0
OUR MISSION
GREAT PRODUCTS
How We Can Empower
We build products and offer services that connect people to the investing information and tools they need. We put in extra work to improve what we do—and we’re always looking for new ideas to empower investors.
Learn more about our products and services.
EMPOWERING INVESTORS
Meet Our
Leadership Team
Morningstar leaders bring a diverse set of skills and experiences to their work—united by their commitment to our mission to empower investor success.
Learn more about our leadership team.
GREAT PEOPLE
Seeking the Thinkers and the Doers

I like working on new ways to help our customers.
Laura Lutton
Director, ESG Research-Risk Product Lead
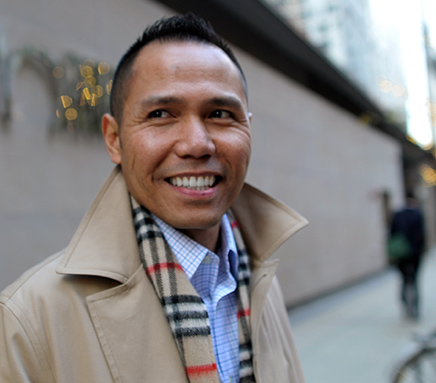
I’m proud to be affiliated with a great brand.
Noel Abat
Director of Sales Operations

I enjoy working with people from many fields
Anna Mukhina
Senior Manager of Software Engineering
Want to work at Morningstar?
GLOBAL REACH
Being There for Investors—Where They Are
We’re constantly collaborating with co-workers in our global offices. And our teams of client support specialists are there too—ready to answer your questions